

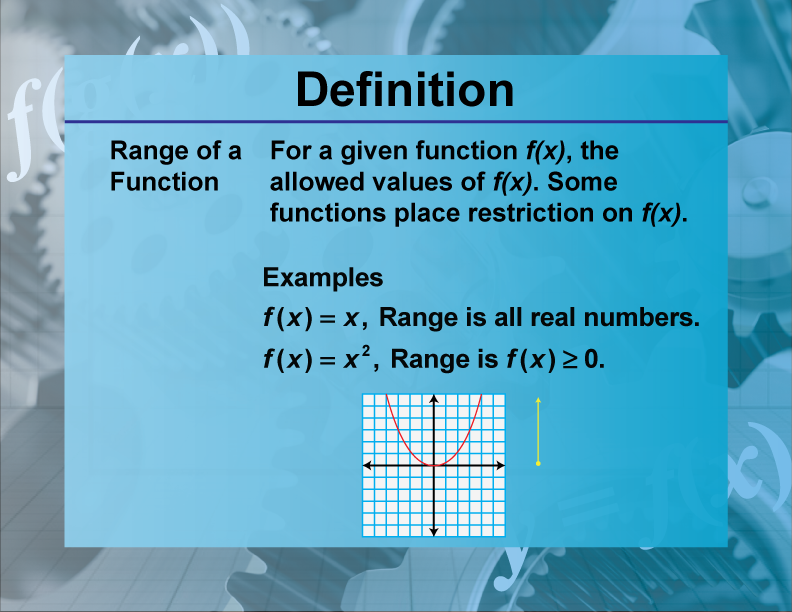
Understanding the basic concepts of mathematics becomes much easier when each term is connected to a practical idea. One such important concept is range. Students often encounter range while working with data sets, statistics, graphs, and basic arithmetic, but the term can sometimes seem confusing because it is used in different mathematical situations. At its simplest, range meaning math refers to the difference between the largest and smallest values in a given set of numbers.
The range gives a quick idea of how widely values are spread. For example, imagine that five students receive scores of 62, 70, 74, 81, and 89 on a test. The highest score is 89 and the lowest score is 62. Subtracting the lowest value from the highest gives a range of 27. This single number does not describe every detail about the scores, but it immediately tells us how far apart the extreme values are.
The concept is particularly useful because it is simple to calculate and easy to interpret. Whether you are studying elementary mathematics, statistics, data analysis, or probability, knowing how to identify and calculate a range can help you understand the variation within a collection of numbers.
What Is the Range Meaning Math?
The range meaning math can be explained as the difference between the maximum value and the minimum value in a data set. In other words, the range measures the distance between the two extreme values. The maximum is the largest number in the data set, while the minimum is the smallest number.
The standard formula is straightforward:
Range = Maximum Value − Minimum Value
Suppose a data set contains the numbers 12, 18, 25, 31, and 40. The largest number is 40, and the smallest number is 12. Therefore, the range is 40 − 12, which equals 28. Notice that you do not need to add every number or calculate an average to find the range. You only need to identify the two extreme values.
This makes range one of the quickest ways to describe variation in a data set. However, range should not be confused with the average or median. The average describes a central value, while the range describes the distance between the lowest and highest observations.
How to Find the Range of a Data Set
Finding a range usually requires only a few steps, but accuracy depends on correctly identifying the smallest and largest values. If the numbers are not arranged in order, it is often useful to scan the entire data set before performing the subtraction.
Consider the data set:
15, 8, 24, 19, 11, 30
The smallest value is 8 and the largest value is 30. Applying the formula gives:
Range = 30 − 8 = 22
The order in which the numbers are presented does not affect the answer. You do not have to arrange every number from smallest to largest as long as you correctly identify the minimum and maximum values.
A useful way to approach range problems is to first look for the extreme values rather than immediately calculating. This reduces unnecessary work and makes it easier to avoid arithmetic mistakes. For larger data sets, organizing the values in ascending order can make the minimum and maximum easier to spot.
Steps for Calculating Range
The process can be summarized in a few simple steps:
- Identify the smallest value in the data set.
- Identify the largest value in the data set.
- Subtract the smallest value from the largest value.
- State the result as the range.
For example, if the values are 42, 55, 38, 67, and 49, the minimum is 38 and the maximum is 67. Therefore, the range is 67 − 38 = 29.
Range Examples in Mathematics
Examples are one of the best ways to understand range meaning math because the concept becomes clearer when applied to actual numbers. Consider a data set containing the ages 21, 24, 29, 31, and 36. The smallest age is 21, while the largest age is 36. The range is therefore 15 years.
Now consider a different example involving temperatures. Suppose the recorded temperatures over several days are 18°C, 22°C, 25°C, 20°C, and 29°C. The lowest temperature is 18°C and the highest is 29°C. The range is 11°C. This tells us that the difference between the warmest and coolest recorded temperatures was 11 degrees.
Negative numbers also work with the same formula. Suppose the numbers are −12, −5, 0, 7, and 14. The maximum is 14 and the minimum is −12. Therefore:
Range = 14 − (−12) = 26
The negative sign is important here. Subtracting a negative number is equivalent to adding its positive value. This is why the range extends across 26 units rather than simply being 2 or another smaller value.
Range and the Spread of Data
One major reason the range matters is that it provides information about the spread of data. If two data sets have similar average values but very different ranges, their distributions may be considerably different.
For instance, consider two groups. Group A has values of 48, 49, 50, 51, and 52. Its range is 4. Group B has values of 20, 35, 50, 65, and 80. Its range is 60. Both groups have a middle value around 50, but Group B has values that are much more widely distributed.
This illustrates an important point: range gives information about variability, but it does not explain the entire shape of a data set. A data set can have a large range because of one unusually high or low observation. Likewise, a small range indicates that the extreme values are relatively close together, but it does not necessarily mean every observation is identical.
Why Range Is Useful
Range is useful when you need a quick measurement of variation. In basic statistics, it can help someone immediately compare the spread of different data sets without performing more complicated calculations.
For example, a teacher could compare the range of test scores in two classes. A business might examine the range of daily sales figures. A scientist could compare the range of measurements collected during an experiment. In each case, range provides a simple description of how far apart the extreme observations are.
However, range is sensitive to outliers. If one value is unusually large or unusually small, it can dramatically increase the range. For this reason, more advanced statistical analysis may also use measures such as variance, standard deviation, or the interquartile range.
Range Compared With Mean, Median, and Mode
Students sometimes confuse range with other common statistical terms. The mean, median, mode, and range all describe data, but they answer different questions.
The mean is commonly called the average and is found by adding all values and dividing by the number of values. The median is the middle value after the data has been arranged in order. The mode is the value that occurs most frequently. Range, by contrast, focuses only on the highest and lowest values.
| Mathematical Measure | What It Describes | Basic Method |
|---|---|---|
| Mean | Average value | Add values and divide by count |
| Median | Middle value | Arrange values and find the center |
| Mode | Most frequent value | Identify the repeated value |
| Range | Overall distance between extremes | Maximum − Minimum |
Understanding these differences is essential when interpreting data. If someone wants to know the typical value, the mean or median may be more appropriate. If they want to know which value appears most often, the mode is useful. If they want a quick measurement of the distance between the extremes, range is the relevant measure.
Range With Decimals and Fractions
The idea behind range meaning math does not change when the data contains decimals or fractions. The same maximum-minus-minimum formula continues to apply.
Suppose a data set contains 2.4, 3.7, 1.9, 5.2, and 4.1. The maximum is 5.2 and the minimum is 1.9. Therefore, the range is 3.3.
Fractions work in exactly the same way. If the smallest value is 1/4 and the largest value is 7/4, the range is:
7/4 − 1/4 = 6/4 = 3/2
The main challenge with fractions is usually simplifying the subtraction correctly. Once the largest and smallest values have been identified, the underlying range calculation remains the same.
Range With Negative Numbers
Negative numbers are another area where students can make mistakes. The key is to remember that the minimum value is the number farthest to the negative side of the number line, while the maximum value is the number farthest to the positive side.
For example, consider −20, −14, −3, 5, and 11. The minimum is −20 and the maximum is 11. The range is:
11 − (−20) = 31
This can also be understood visually on a number line. The distance from −20 to 11 is 31 units. Thinking about the number line can make negative-number range problems much easier to understand.
Range in Real-World Situations
The practical value of range meaning math becomes especially clear when numbers represent real measurements. Range can be used to describe differences in temperatures, salaries, test scores, product prices, travel times, rainfall, production quantities, and many other types of data.
Suppose a shop records daily sales of $1,200, $1,450, $1,375, $1,800, and $1,520. The minimum sales amount is $1,200 and the maximum is $1,800. The range is $600. This tells the shop owner how much the highest recorded sales amount differs from the lowest.

Similarly, if a city records temperatures between 16°C and 34°C during a particular period, the temperature range is 18°C. In education, if students receive scores from 55 to 92, the score range is 37 points.
These examples demonstrate why range is more than a classroom formula. It is a practical tool for quickly understanding variation in numerical information.
Limitations of Using Range
Although range is easy to calculate, it does have limitations. The biggest limitation is that it uses only two observations: the maximum and minimum. Every other value in the data set is ignored when calculating the range.
For example, consider two sets: 10, 11, 12, 13, 50 and 10, 20, 30, 40, 50. Both have a range of 40, even though the values between the extremes are distributed very differently. This demonstrates that range alone cannot describe the complete pattern of a data set.
Another limitation is its sensitivity to outliers. If a data set normally contains values between 40 and 60 but one unusual observation is 150, the range becomes 110. That large range may give the impression of substantial variation even though most observations are closely grouped.
For more detailed statistical analysis, researchers may use other measures of spread. Still, range remains valuable as a quick and accessible starting point.
Common Mistakes When Finding the Range
Most range errors occur because students either identify the wrong extreme values or perform the subtraction incorrectly. A common mistake is subtracting the second-largest value from the largest rather than using the actual minimum.
Another frequent error occurs when negative numbers are involved. For example, if the maximum is 8 and the minimum is −6, the correct calculation is 8 − (−6), which equals 14. Treating the negative sign incorrectly can produce a wrong answer.
It is also important not to confuse range with the number of values in a data set. If a set contains ten numbers, its range is not automatically ten. Range depends entirely on the difference between the largest and smallest values.
When checking an answer, identify the minimum and maximum again and perform the subtraction one more time. This simple verification method can catch many mistakes.
Range in Statistics and Data Analysis
In statistics, range is considered one of the basic measures of dispersion. Dispersion describes how much observations vary from one another. While range is not as detailed as some advanced statistical measures, it is easy to calculate and communicate.
The concept is particularly useful during an initial examination of a data set. Before performing more complex calculations, an analyst may look at the minimum, maximum, and range to gain a quick understanding of the data’s scale.
In modern data analysis, computers and spreadsheets can calculate ranges almost instantly, even when thousands or millions of observations are involved. Despite the availability of sophisticated software, understanding the underlying formula remains important because it allows users to interpret what the calculated result actually represents.
Conclusion
The range meaning math is fundamentally about measuring the distance between the smallest and largest values in a data set. The formula is simple: subtract the minimum value from the maximum value. Despite this simplicity, range provides useful information about how widely numerical observations are spread. Learning range also creates a foundation for understanding broader statistical concepts. By comparing range with the mean, median, mode, and other measures of variation, students can develop a clearer picture of how numerical data is interpreted. Range can be used with whole numbers, decimals, fractions, positive values, and negative values, making it a flexible mathematical concept.