
Introduction
Mathematics is full of concepts that help us make sense of numbers and patterns in the world around us. Among these concepts, measures of central tendency play a crucial role in summarizing data. One of the simplest yet most useful among them is the mode. Many learners often ask, what is mode in math, especially when they first encounter statistics.
In this detailed guide, we will explore the concept of mode from the ground up. You will learn its meaning, importance, types, methods of calculation, and real-world applications. By the end, you will not only understand the concept clearly but also feel confident applying it in practical situations.
What Is Mode in Mathematics?

To begin with, let’s answer the fundamental question: what is mode in math. The mode is defined as the value that appears most frequently in a dataset. It is the number that repeats more often than any other number in a given list.
Unlike the mean, which involves adding and dividing, or the median, which requires ordering and finding the middle value, the mode focuses purely on frequency. This makes it one of the easiest statistical measures to understand and calculate.
For example, consider the dataset:
2, 5, 5, 7, 9
Here, the number 5 appears twice, while all other numbers appear only once. Therefore, the mode is 5.
This simple idea becomes extremely powerful when dealing with large datasets, surveys, or real-world observations.
Why Understanding Mode Is Important
When learning what is mode in math, it’s equally important to understand why it matters. The mode provides insight into the most common or typical value in a dataset. This can be incredibly useful in both academic and real-life situations.
For instance, businesses often use mode to determine the most popular product size or color. Teachers may use it to identify the most common score in a class. Similarly, researchers rely on mode to analyze trends in survey responses.
Because it highlights frequency rather than averages, mode is especially useful when dealing with categorical data, such as favorite colors, brands, or choices.
Key Characteristics of Mode
The mode has several unique properties that distinguish it from other statistical measures. Understanding these characteristics helps clarify what is mode in math in a deeper way.
First, the mode is not affected by extreme values, also known as outliers. This makes it reliable in datasets where unusually large or small numbers exist.
Second, a dataset can have one mode, more than one mode, or no mode at all. This flexibility makes it different from mean and median, which always produce a single value.
Finally, the mode can be used with both numerical and non-numerical data. For example, it can identify the most common fruit in a list just as easily as it identifies the most frequent number.
Types of Mode in Data
When exploring what is mode in math, it’s important to understand that not all datasets behave the same way. Based on frequency, datasets can be categorized into different types.
Unimodal Data
A dataset with only one value occurring most frequently is called unimodal. This is the simplest and most common case.
For example:
4, 6, 6, 8, 10
Here, 6 appears most often, so the dataset is unimodal with a mode of 6.
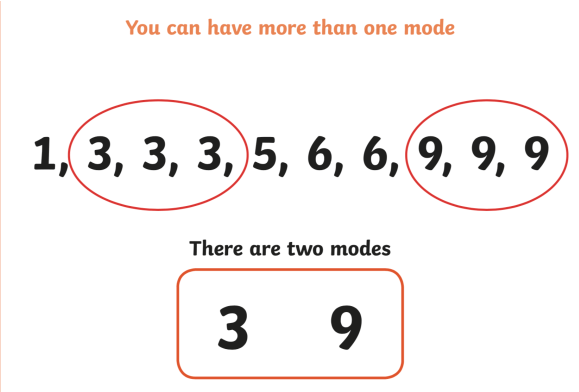
Bimodal Data
Sometimes, two values share the highest frequency. Such datasets are called bimodal.
For example:
2, 3, 3, 7, 7, 9
Both 3 and 7 appear twice, making them modes. This indicates that the data has two peaks.
Multimodal Data
In some cases, more than two values repeat with the same highest frequency. These datasets are called multimodal.
For example:
1, 2, 2, 3, 3, 4, 4
Here, 2, 3, and 4 are all modes. This suggests multiple common values in the dataset.
No Mode
A dataset may also have no mode if all values occur only once.
For example:
5, 6, 7, 8, 9
Since no number repeats, there is no mode.
How to Find the Mode Step by Step
Understanding what is mode in math also requires knowing how to calculate it effectively. The process is straightforward and does not involve complex formulas.
First, arrange the data in order. This step is optional but helps in identifying repeated values easily.
Next, count how many times each value appears in the dataset. This is called frequency.
Finally, identify the value with the highest frequency. That value is the mode.
For example:
Dataset: 3, 8, 8, 6, 7
After counting:
3 → 1 time
8 → 2 times
6 → 1 time
7 → 1 time
Mode = 8
Mode Compared to Mean and Median
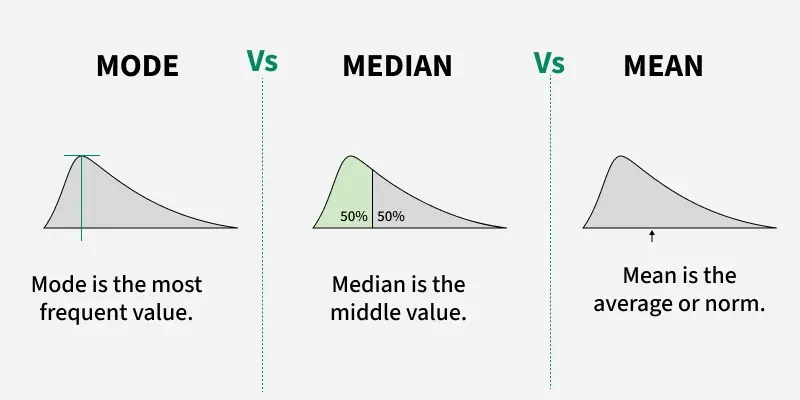
To fully grasp what is mode in math, it helps to compare it with other measures of central tendency.
The mean is the average of all values, calculated by adding them and dividing by the total number of values. The median is the middle value when data is arranged in order.
The mode, however, is the most frequent value. Each measure provides a different perspective on the data.
For example, in the dataset:
1, 2, 2, 3, 9
Mean = 3.4
Median = 2
Mode = 2
Here, the mode and median match, but the mean is influenced by the larger number 9.
Mode in Grouped Data
In real-world scenarios, data is often grouped into intervals. In such cases, finding the exact mode is slightly different.
Instead of identifying a single number, we determine the modal class—the interval with the highest frequency.
Example Table
| Class Interval | Frequency |
|---|---|
| 0–10 | 4 |
| 10–20 | 9 |
| 20–30 | 6 |
| 30–40 | 2 |
In this table, the interval 10–20 has the highest frequency. Therefore, it is the modal class.
Real-Life Applications of Mode
One of the best ways to understand what is mode in math is by looking at its applications in everyday life. Mode is widely used across various fields because of its simplicity and usefulness.
In retail, companies analyze customer preferences to determine the most popular product. In education, teachers use mode to identify common performance levels. In weather analysis, the most frequently occurring temperature over a period can be considered the mode.
Even in social media analytics, mode helps identify the most common type of content users engage with.
Advantages of Using Mode
Mode offers several benefits that make it a preferred measure in many situations.
It is easy to calculate and understand, even for beginners. It does not require complex mathematical operations, making it accessible to all learners.
Another advantage is that it works well with categorical data. Unlike mean and median, which require numerical values, mode can handle non-numeric data such as colors or names.
Additionally, it is not affected by extreme values, ensuring that unusual data points do not distort the result.
Limitations of Mode
While learning what is mode in math, it is equally important to recognize its limitations.
One major drawback is that a dataset may not have a mode at all. This can make it less useful in certain situations.
Another limitation is that it does not consider all values in the dataset. It only focuses on frequency, which may not always represent the overall distribution accurately.
In some cases, having multiple modes can also create confusion, especially when trying to draw conclusions from the data.
Mode in Graphical Representation
Graphs and charts provide a visual way to understand data, and mode plays a key role in interpreting them.
In bar graphs, the tallest bar represents the mode. In histograms, the highest peak indicates the modal class.
These visual tools make it easier to identify patterns and trends without performing calculations.
Common Mistakes Students Make
When trying to understand what is mode in math, students often make a few common mistakes.
One frequent error is confusing mode with mean or median. Each measure serves a different purpose, so it’s important to distinguish between them.
Another mistake is overlooking multiple modes in a dataset. Students may identify only one value when there are actually two or more.
Finally, some learners forget to check whether a dataset has no mode at all, leading to incorrect conclusions.
Practice Examples for Better Understanding
Let’s reinforce the concept with a few examples.
Dataset: 6, 6, 7, 8, 9
Mode = 6
Dataset: 2, 3, 4, 5
Mode = None
Dataset: 1, 1, 2, 2, 3
Modes = 1 and 2
Practicing such examples helps build confidence and improves accuracy.
Quick Summary
Mode in Mathematics:
- Definition: Most frequently occurring value
- Types: Unimodal, Bimodal, Multimodal
- Use: Identifying common patterns in data
- Limitation: May not exist in every dataset
FAQs About Mode
What is mode in math in simple words?
It is the number that appears most frequently in a dataset.
Can there be more than one mode?
Yes, datasets can be bimodal or multimodal with multiple values repeating equally.
What happens if no number repeats?
In that case, the dataset has no mode.
Is mode affected by large numbers?
No, it only depends on how often values appear, not their size.
Where is mode used in real life?
It is used in business, education, surveys, and data analysis to identify common trends.
Conclusion: Mastering Mode for Everyday Use
By now, you should have a clear and complete understanding of what is mode in math and why it is such an important concept. From simple classroom examples to complex real-world data, the mode helps identify the most common values quickly and effectively.
Its simplicity makes it an excellent starting point for anyone learning statistics, while its practical applications make it valuable in everyday decision-making.
Start observing patterns around you. Look at things like daily temperatures, favorite foods among friends, or common test scores. Try identifying the mode in these situations to strengthen your understanding.
The more you practice, the more natural it will feel. And once you truly grasp how mode works, you’ll find it much easier to interpret data and make informed decisions based on real patterns.
