
Introduction
Mathematics often feels complex at first glance, but many of its most powerful ideas are built on simple foundations. One such idea is the concept of range. If you’ve ever worked with numbers, datasets, or even graphs, you’ve probably come across this term. Still, many learners pause and wonder, what is range in math and why does it matter so much?
In this detailed guide, we’ll explore the concept of range from multiple angles. We’ll start with the basic definition and then gradually move into deeper explanations, real-life applications, and advanced interpretations. The goal is to make the idea feel intuitive, practical, and easy to apply.
By the end of this article, you won’t just know what range is—you’ll understand how to use it confidently in different mathematical situations.
What Does Range Mean in Mathematics?

At its core, range is a measure of how spread out a set of numbers is. It tells us the difference between the largest value and the smallest value in a dataset.
When someone asks what is range in math, they are usually referring to this basic definition used in statistics and arithmetic. It is one of the simplest ways to understand variability in data.
Imagine you have the numbers 4, 8, 15, 16, and 23. To find the range, you identify the highest number, which is 23, and the lowest number, which is 4. Subtracting the two gives you 19. That value represents how wide the data spreads.
This simplicity is what makes range such a useful starting point for analyzing data.
Why Range Is Important in Understanding Data
Range plays a crucial role in interpreting data quickly. While it doesn’t give a complete picture, it provides an immediate sense of how much variation exists.
For example, if two classes take the same test and one class has a range of 10 while the other has a range of 40, it’s clear that the second class has more variation in scores. Even without deeper analysis, range helps highlight this difference.
It is especially helpful when you need a quick comparison or a basic overview. Because of its simplicity, range is often the first statistical concept introduced to students.
Understanding what is range in math also helps build a foundation for more advanced topics like variance and standard deviation.
The Formula for Range Explained Clearly
The formula for range is straightforward and easy to remember:
Range = Maximum Value − Minimum Value
This formula works regardless of the size of the dataset. Whether you are working with five numbers or five thousand, the process remains the same.
To apply it correctly, you must carefully identify the highest and lowest values. This step is crucial because even a small mistake can lead to an incorrect result.
The beauty of this formula lies in its simplicity. It doesn’t require complex calculations, making it accessible to learners at all levels.
Step-by-Step Example to Understand Range
Let’s walk through a detailed example to make the concept crystal clear.
Suppose you have the following dataset: 12, 7, 25, 30, 18, 5
First, identify the highest number. In this case, it is 30. Next, find the lowest number, which is 5. Subtracting 5 from 30 gives you 25.
So, the range of this dataset is 25.
This step-by-step approach helps reinforce the idea and ensures accuracy. Once you practice a few examples, the process becomes second nature.
Understanding Range with Negative Numbers
Working with negative numbers can sometimes confuse learners, but the concept remains the same.
Consider the dataset: −10, −3, 0, 5, 9
Here, the highest value is 9, and the lowest value is −10. When you subtract, you get:
9 − (−10) = 19
The key thing to remember is that subtracting a negative number increases the value. This is an important detail when learning what is range in math.
With practice, handling negative numbers becomes just as easy as working with positive ones.
Range in Real-Life Situations
Range is not just a classroom concept—it appears in everyday life more often than you might realize.
Think about weather changes. If the temperature in a day ranges from 20°C to 35°C, the range is 15°C. This tells you how much variation occurred throughout the day.
In education, teachers often use range to understand how students performed on a test. A small range suggests similar performance, while a large range indicates a wider gap.
In business, companies track changes in sales or profits using range to understand fluctuations. These real-world examples show how practical and relevant this concept is.
Types of Range in Mathematics
While the basic idea of range remains consistent, its meaning can vary slightly depending on the context.
Range in Statistics
In statistics, range measures the spread of a dataset. It is often used as a quick way to understand variability before applying more advanced methods.
Range in Functions
In algebra, range refers to all possible output values of a function. This is a broader interpretation compared to simple datasets.
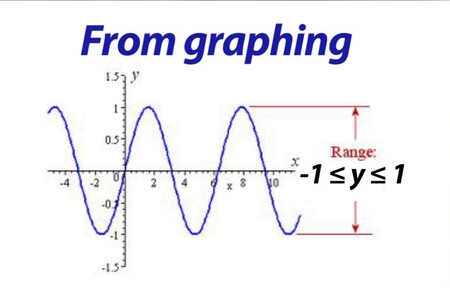
Range in Graphs
When working with graphs, range represents all the y-values that a function can take. This visual representation helps deepen understanding.
Each of these interpretations builds on the same fundamental idea of variation and spread.
Range Compared to Other Measures of Spread
Range is just one of several ways to measure how data varies. While it is the simplest, it is not always the most detailed.
Below is a comparison to help you understand its place among other statistical measures:
| Measure | What It Represents | Complexity | Best Use Case |
|---|---|---|---|
| Range | Difference between max and min | Easy | Quick overview |
| Mean Deviation | Average distance from the mean | Medium | Moderate analysis |
| Variance | Squared spread of data | Complex | Statistical modeling |
| Standard Deviation | Square root of variance | Complex | Deep data interpretation |
Range is ideal for quick insights but should be combined with other measures for deeper analysis.
Limitations of Range You Should Know
Although range is useful, it has certain limitations that you should keep in mind.
One major drawback is that it only considers two values—the highest and the lowest. This means it ignores all other data points, which can sometimes lead to misleading conclusions.
Another limitation is its sensitivity to outliers. A single extreme value can significantly affect the range, making the dataset appear more spread out than it actually is.
Understanding these limitations helps you use range more effectively and avoid common mistakes.
Range in Functions and Algebra
In algebra, the concept of range takes on a slightly different meaning. Instead of focusing on a set of numbers, it refers to the outputs of a function.
For example, consider the function f(x) = x². No matter what value you input, the output will always be zero or positive. This means the range includes all values greater than or equal to zero.
This interpretation is especially important when studying higher-level mathematics. It expands your understanding beyond simple calculations.
Domain vs Range: Key Differences
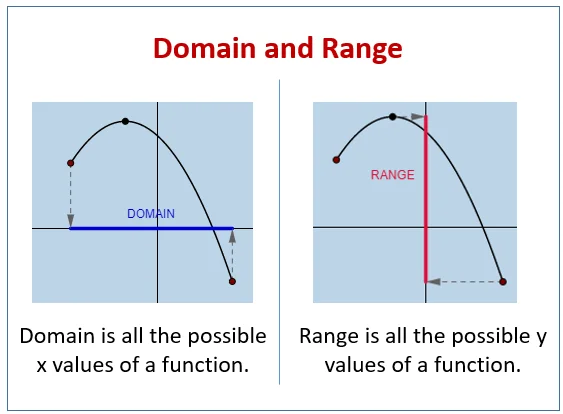
Domain and range are closely related concepts, but they are not the same.
The domain refers to all possible input values, while the range refers to all possible output values. Together, they describe how a function behaves.
For example, in the function f(x) = 2x + 1, the domain can include all real numbers. The range will also include all real numbers because the output can vary infinitely.
Understanding this distinction is essential when exploring what is range in math in more advanced contexts.
Visualizing Range Through Graphs
Graphs provide a powerful way to understand range visually. Instead of just numbers, you can see how values change.
On a graph, the vertical axis represents the range. By observing how far the graph extends up and down, you can determine the range of the function.
For example, if a graph stretches from y = 2 to y = 10, then the range is all values between 2 and 10.
This visual approach makes abstract concepts easier to grasp.
Range in Data Analysis and Research
In data analysis, range is often used as a quick diagnostic tool. Analysts use it to get an initial sense of variability before applying more detailed methods.
For example, if a dataset has a very large range, it suggests high variability. This might prompt further investigation using other statistical tools.
Even in advanced research, range remains a useful starting point. Its simplicity makes it an essential part of any data analysis toolkit.
Common Mistakes When Calculating Range
Many learners make small mistakes when calculating range, especially when they are just starting out.
One common error is forgetting to identify the correct maximum and minimum values. Another mistake is confusing range with average or mean.
Working with negative numbers can also cause confusion if you forget how subtraction works.
By being aware of these pitfalls, you can improve your accuracy and confidence.
Applications of Range in Different Fields
Range is widely used across various fields, making it a versatile and practical concept.
In education, it helps measure student performance differences. In finance, it tracks fluctuations in stock prices or profits.
In science, researchers use range to analyze experimental results and understand variation. Even in sports, range can be used to compare scores and performance levels.
These applications highlight the real-world importance of understanding what is range in math.
Quick Summary
Definition:
Range is the difference between the highest and lowest values in a dataset.
Formula:
Range = Maximum − Minimum
Purpose:
Measures how spread out data is
Key Insight:
Simple but limited—best used with other measures
Frequently Asked Questions (FAQs)
What is the easiest way to understand range?
Range is simply the difference between the largest and smallest numbers in a dataset.
Can range ever be zero?
Yes, if all values in the dataset are the same, the range will be zero.
Why is range important in statistics?
It provides a quick overview of data variability, helping identify how spread out values are.
Is range affected by outliers?
Yes, extreme values can significantly increase the range.
How is range used in real life?
It is used in weather analysis, education, finance, and many other fields to measure variation.
What is the difference between domain and range?
Domain refers to inputs, while range refers to outputs in a function.
Conclusion
Mastering Range for Better Understanding
Understanding what is range in math is a crucial step in building strong mathematical skills. It introduces you to the idea of variability and helps you interpret data more effectively.
While range is simple, its usefulness cannot be underestimated. It provides quick insights and serves as a foundation for more advanced concepts.
To truly master it, practice calculating range with different datasets, including those with negative numbers and outliers. Explore how it works in graphs and functions to deepen your understanding.
By doing so, you’ll not only improve your math skills but also gain a valuable tool for analyzing real-world data.
